Project Overview
This Food Mart Sales Dashboard project was developed as a complete multi-page business intelligence solution designed to provide a well-rounded analysis of overall business performance through three integrated perspectives: sales, products, and customers.
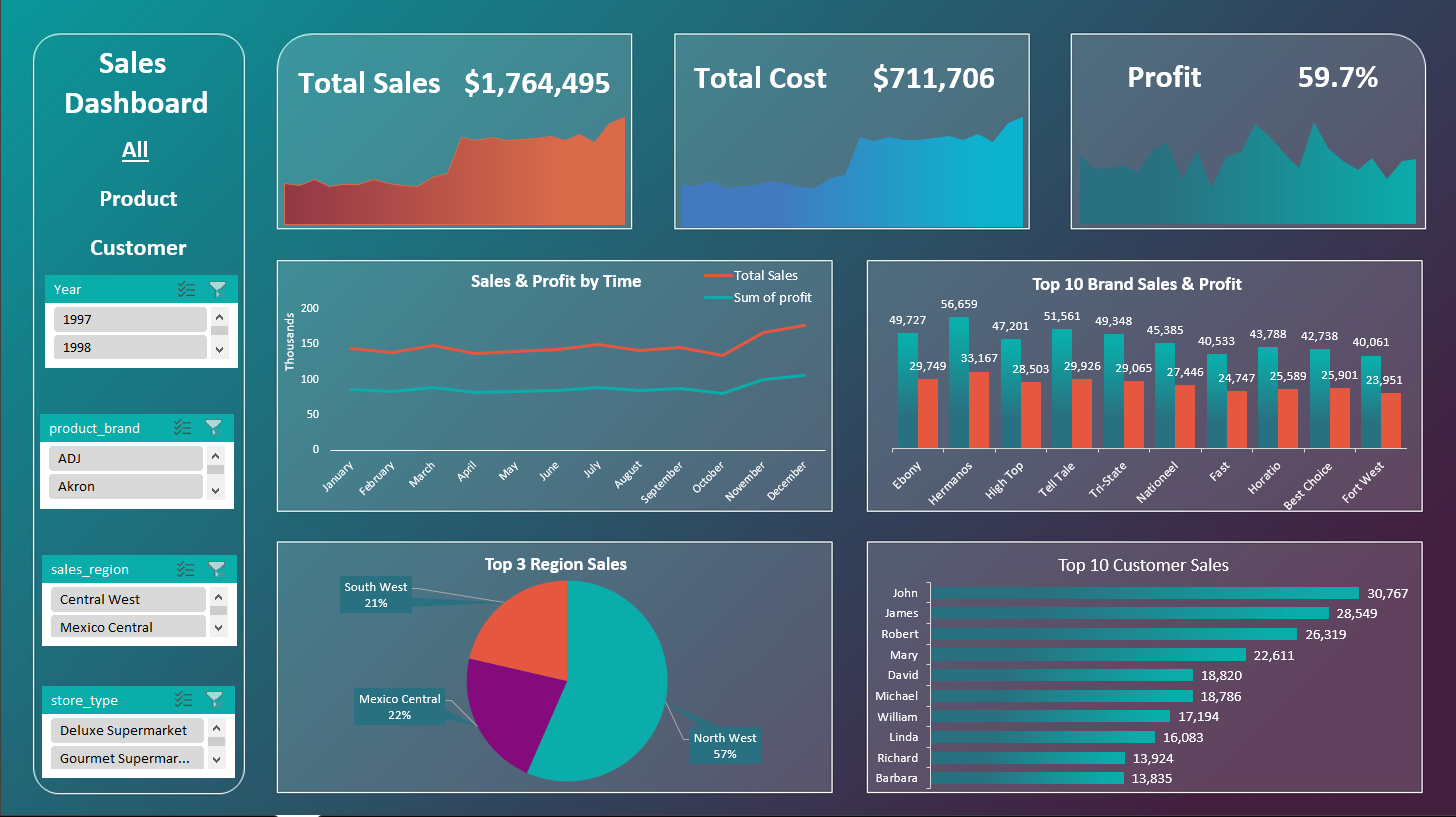
The first page focuses on overall sales performance, presenting the most important business KPIs such as total sales, total cost, and profit, while also analyzing sales and profit trends over time, top-performing brands, leading customers, and the contribution of different sales regions. This view gives a clear high-level understanding of how the business is performing and where the strongest revenue drivers are coming from.
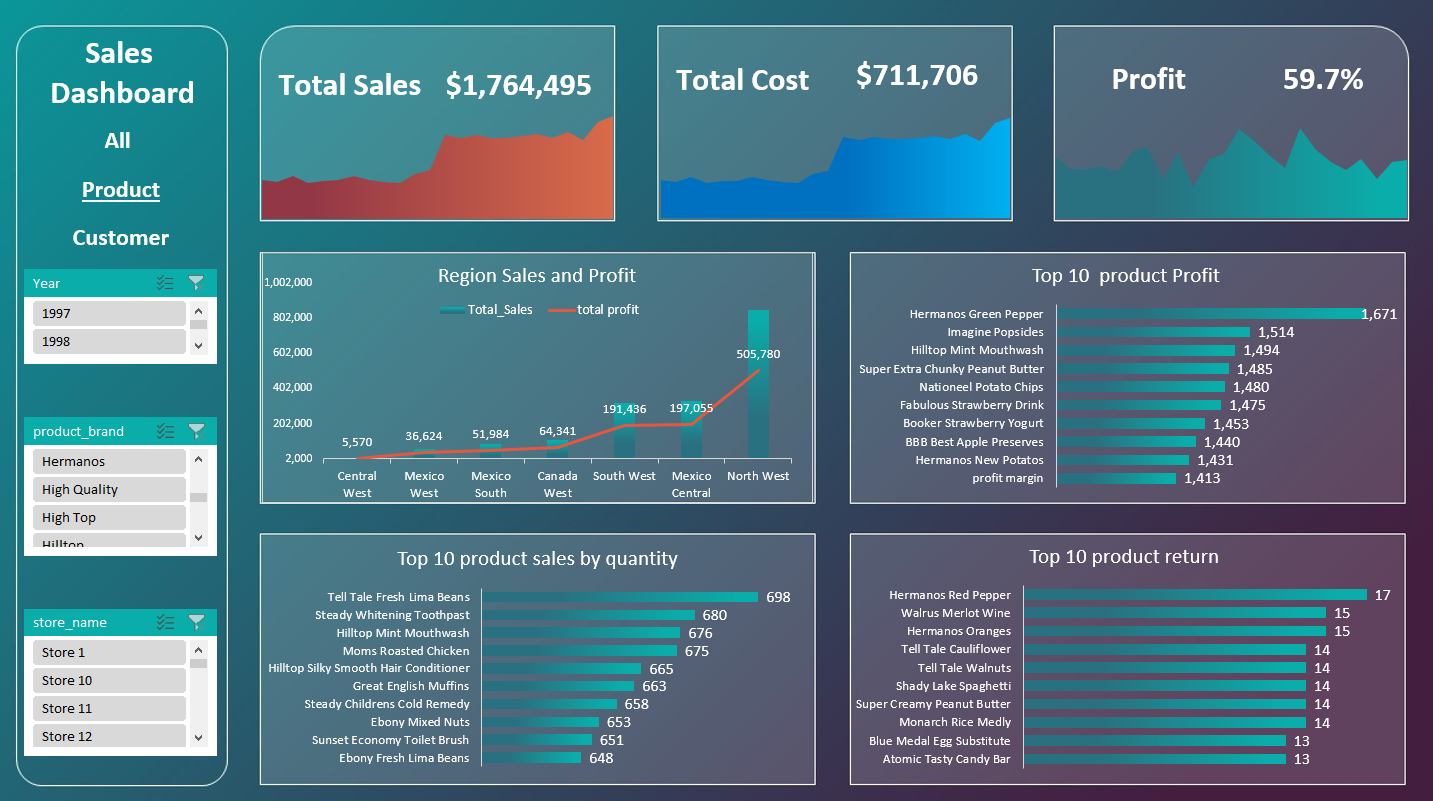
The second page is dedicated to product analysis, where the dashboard explores product performance in greater detail by highlighting the most profitable products, the top-selling products by quantity, regional sales and profit comparisons, and products with the highest return levels. This part of the project helps identify which products add the most business value, which items have the strongest demand, and which areas may require further operational review or product strategy improvement.
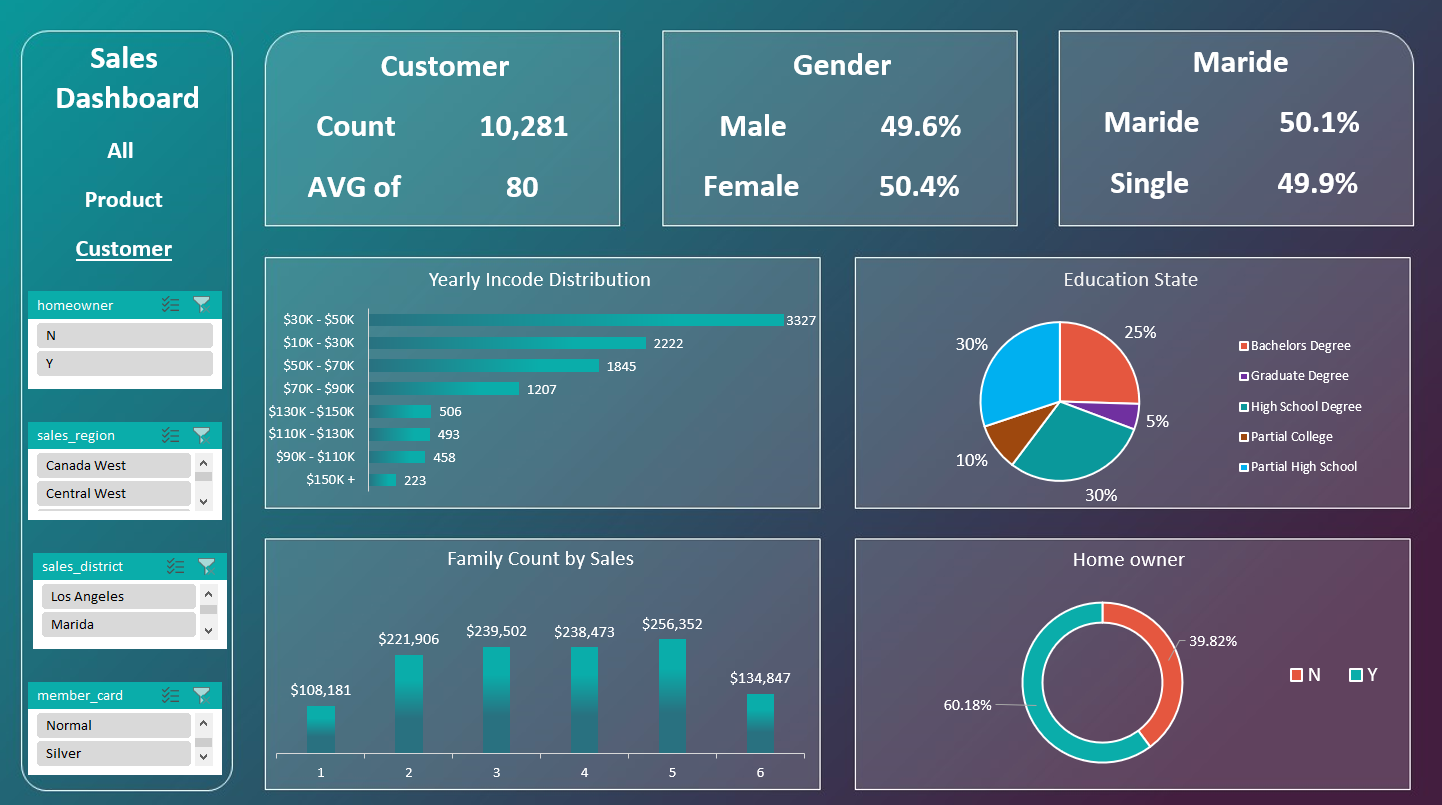
The third page focuses on customer analysis, providing deeper insight into the characteristics and behavior of the customer base. It includes key indicators and visual breakdowns related to customer count, average income, gender distribution, marital status, education level, family size, and home ownership. These insights help build a clearer picture of customer segments and support more targeted decision-making in areas such as sales strategy, customer engagement, and market understanding.
By combining these three analytical views into one structured and interactive dashboard, the project transforms raw business data into meaningful and actionable insights. It allows decision-makers to monitor performance from multiple angles, evaluate products more effectively, understand customer patterns more deeply, and support smarter business planning through a data-driven approach.