Project Overview
This project demonstrates a complete data analytics workflow, beginning with database creation and SQL-based data preparation, and ending with an interactive Excel dashboard for business reporting.
A pizza sales dataset was loaded into a custom SQL database, where multiple analytical queries were written to calculate core KPIs and explore sales trends by time, category, size, and product performance.
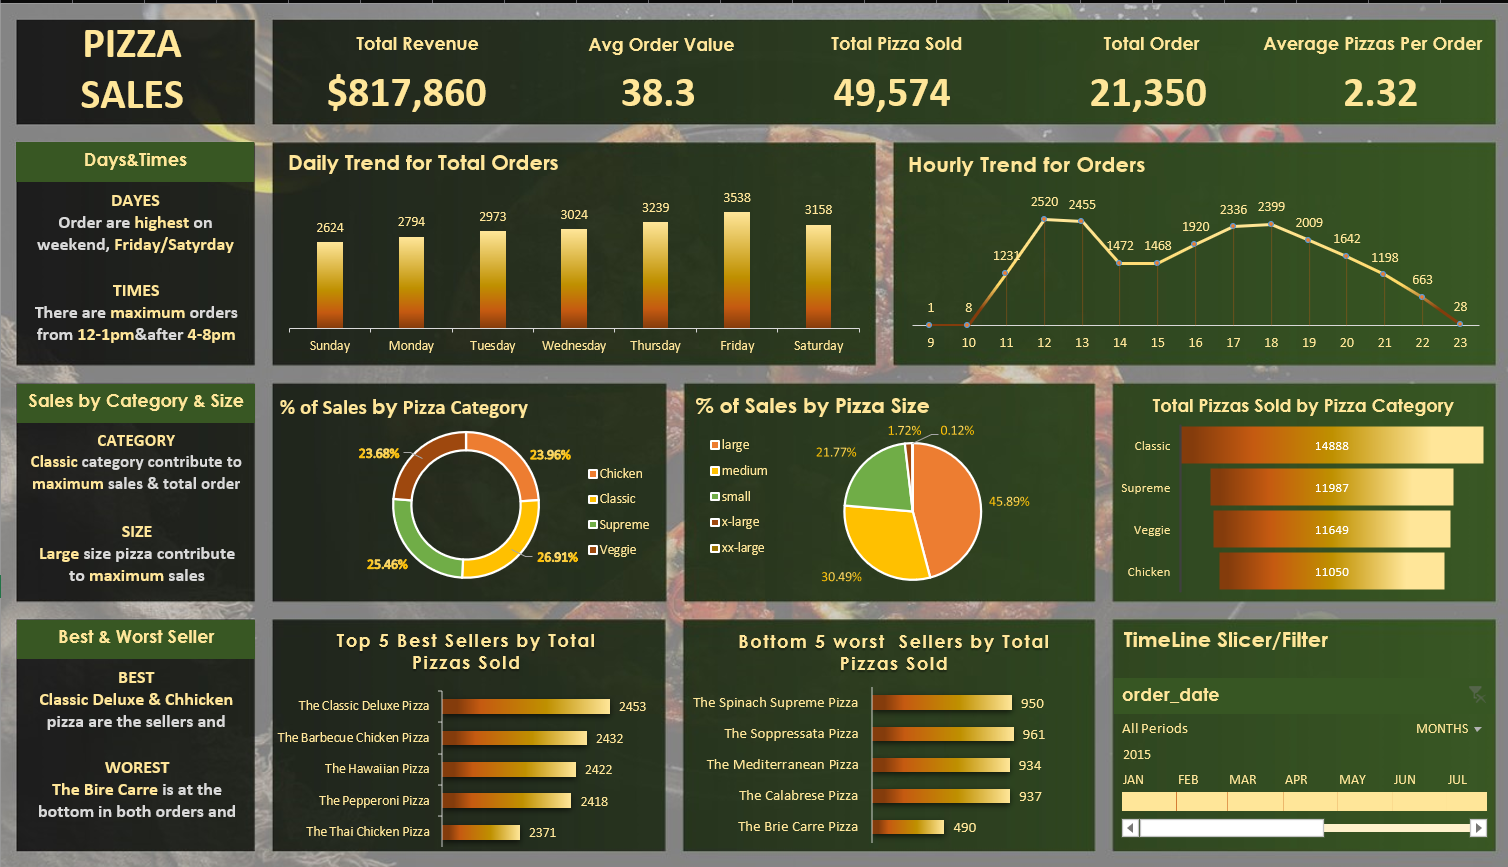
The resulting outputs were exported into Excel and transformed into a dynamic dashboard that highlights revenue performance, customer order behavior, and best- and worst-selling products.
By combining structured data storage, query-based analysis, and clear visual reporting, the project provides a practical example of turning raw transactional data into actionable business insights.