Project Overview
This Item Sales Summary Report was developed as a complete multi-page Power BI analytical solution designed to provide a comprehensive view of sales performance, profitability, and operational details across products, customers, locations, and buying behavior.
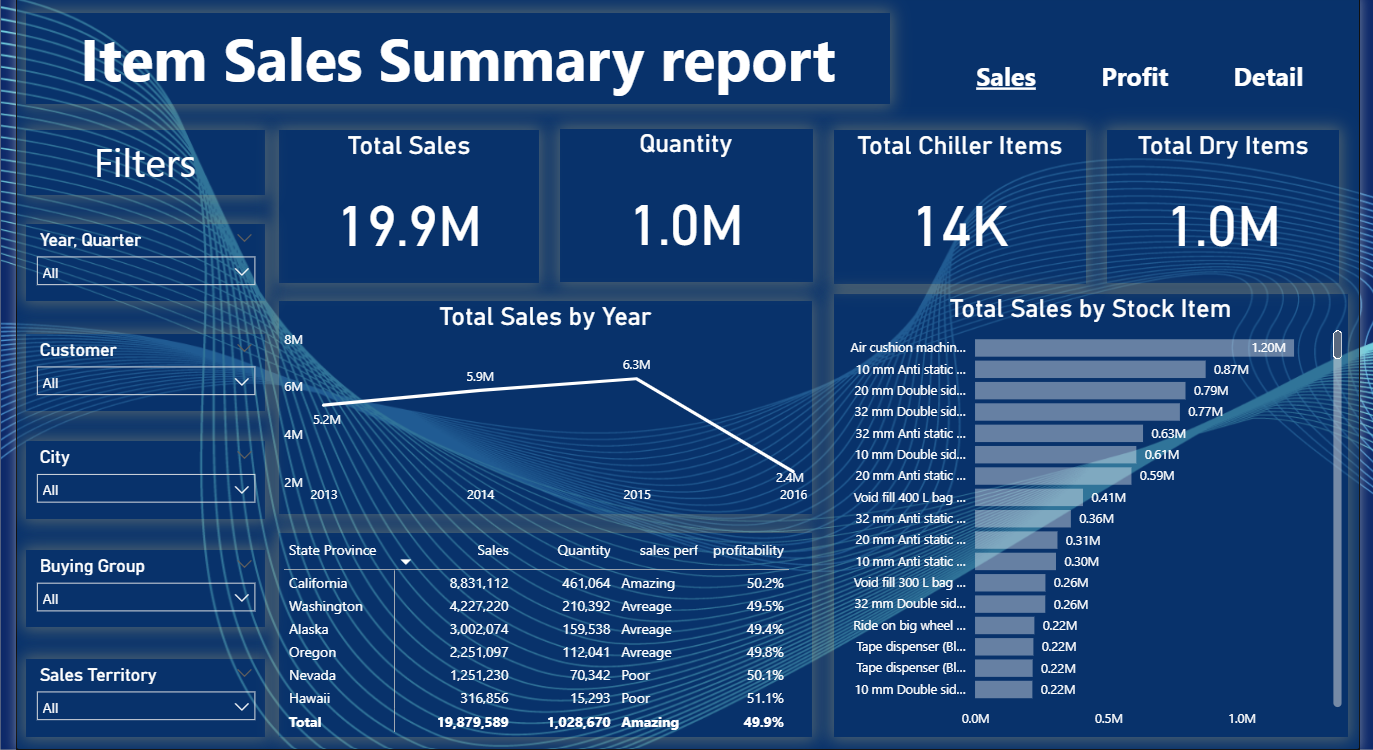
The project was structured into three main report pages. The first page focuses on sales analysis, presenting key performance indicators such as total sales, quantity sold, total chiller items, and total dry items, while also highlighting yearly sales trends, top-performing stock items, and state-level sales performance. This view provides a strong overview of revenue generation and sales distribution across different business dimensions.
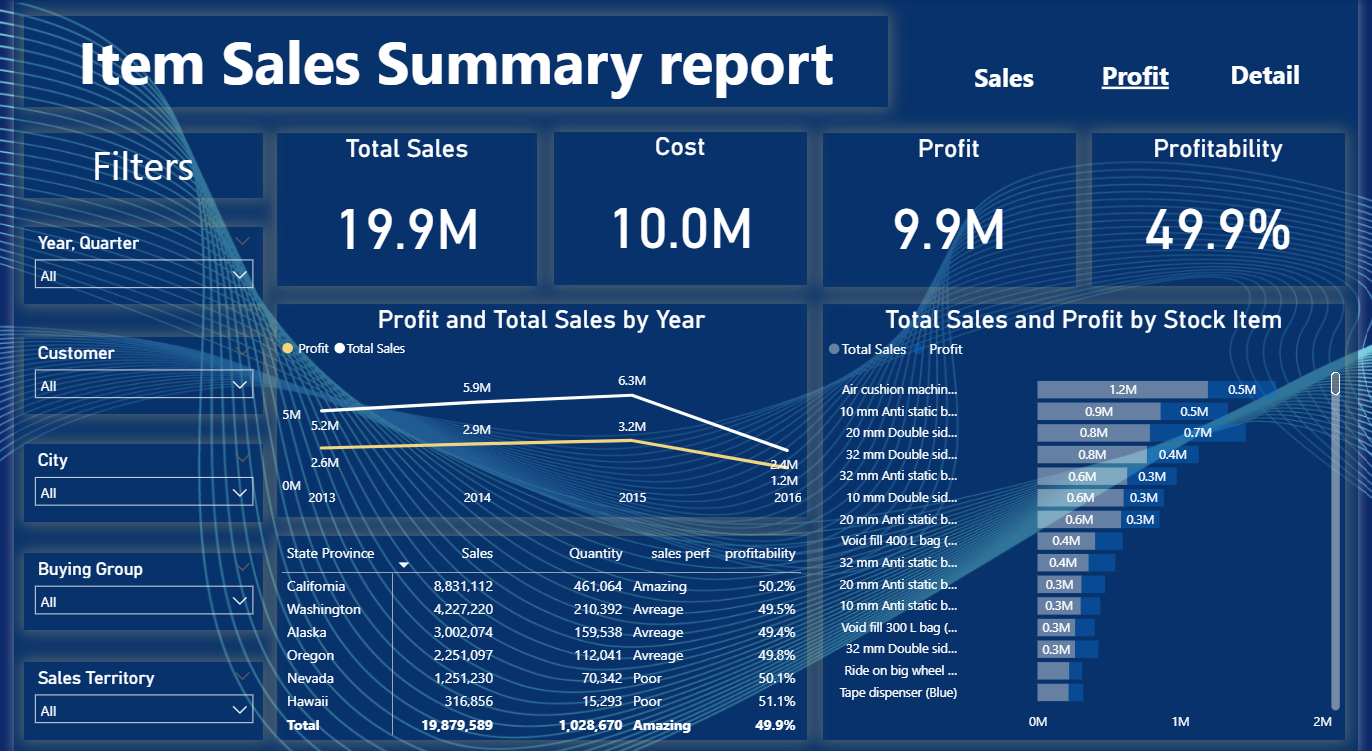
The second page is dedicated to profit analysis, where the report examines total sales, total cost, total profit, and overall profitability. It also compares profit against total sales over time and analyzes profit contribution at the stock-item level, helping identify which products generate the highest financial return and where performance may require closer attention.
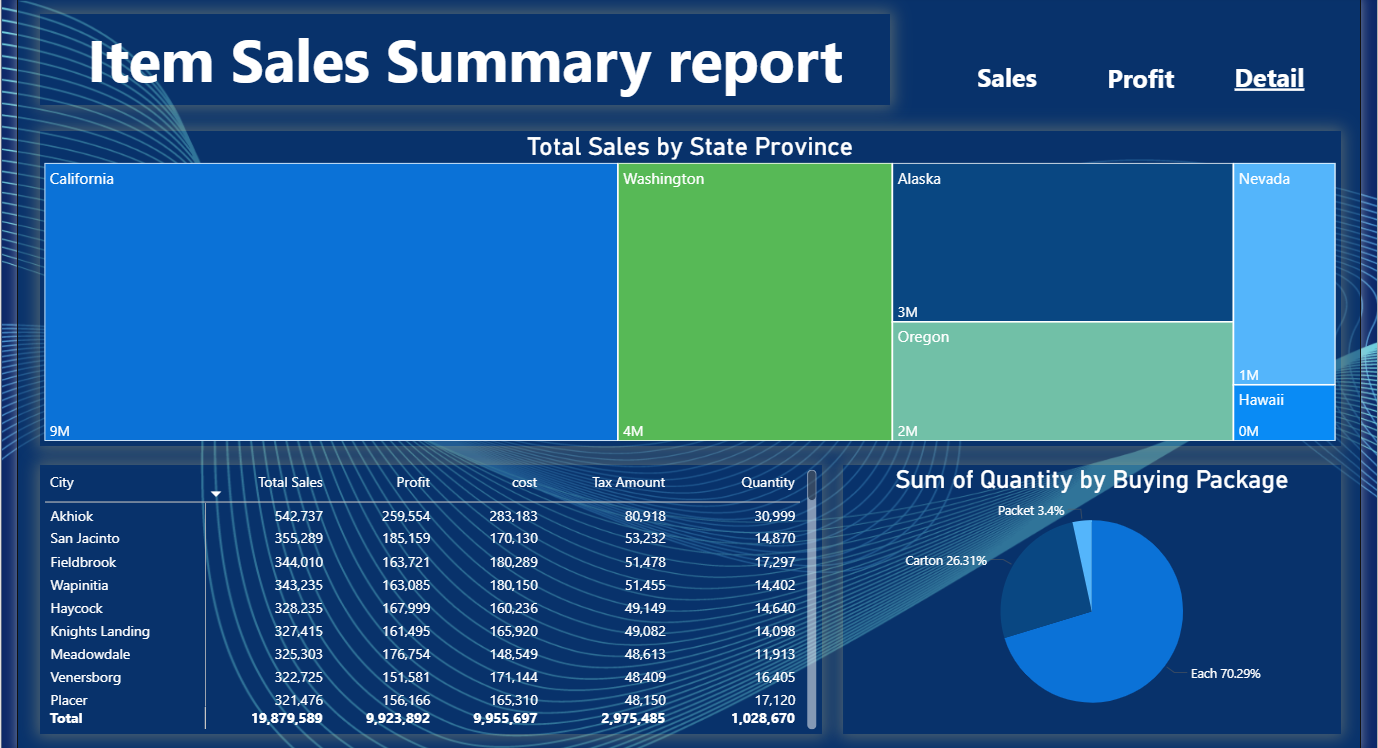
The third page provides a more detailed analytical perspective by drilling deeper into state and city-level performance, cost, tax amount, quantity, and buying package distribution. This section allows users to move beyond summary KPIs and explore the operational details behind sales and profit results in a more granular and decision-oriented way.
From a technical perspective, the project was built using a structured data model that connects fact and dimension tables, including sales, customer, city, employee, date, and stock item data. Additional calculated measures were created to support KPI reporting, profitability analysis, customer evaluation, and conditional performance insights, demonstrating a strong understanding of data modeling and analytical logic in Power BI.
By combining interactive filters, multi-page navigation, detailed tabular analysis, and dynamic visual reporting, the project transforms raw transactional data into meaningful business insights. It enables decision-makers to monitor sales trends, evaluate profit performance, identify top-performing items and locations, and gain a clearer understanding of customer and product behavior through a data-driven reporting experience.