Project Overview
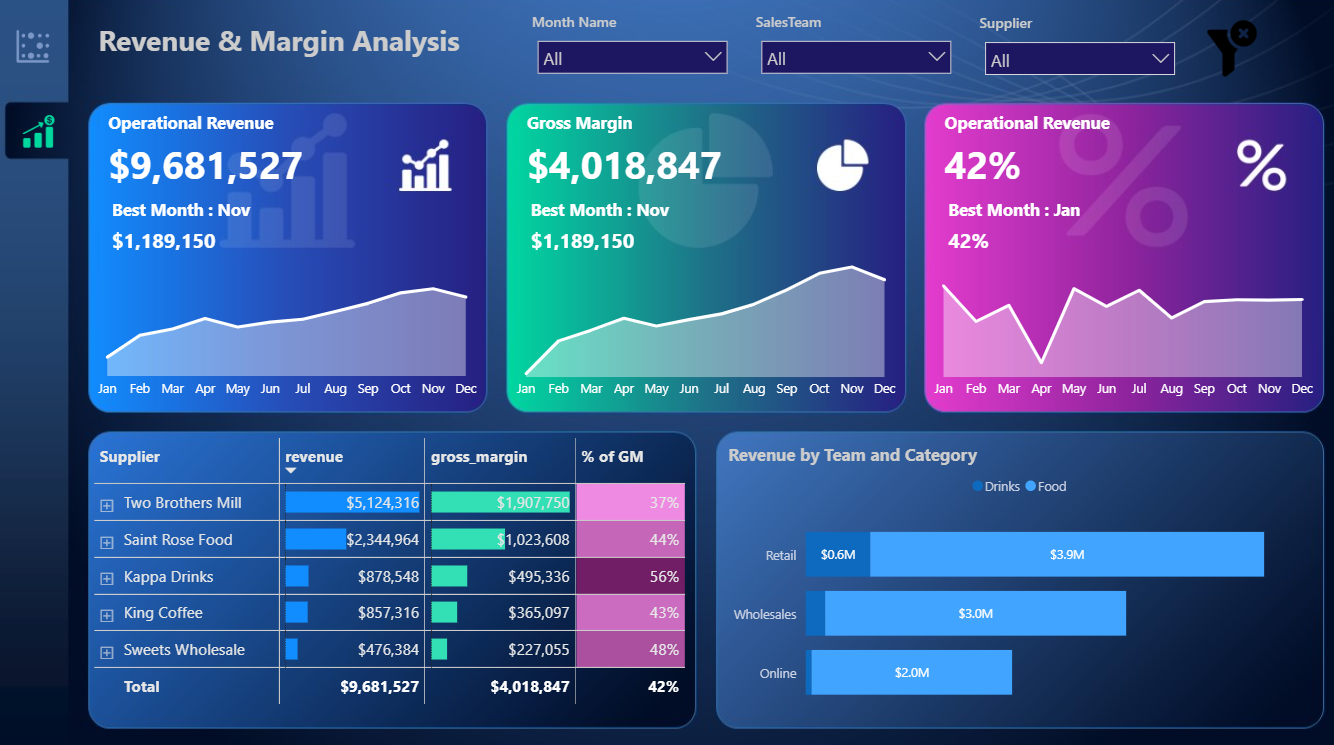
This Revenue & Margin Analysis dashboard was designed as a business intelligence solution to evaluate financial performance and provide deeper insight into the relationship between revenue, cost, and profitability.
The project focuses on essential business metrics such as operational revenue, gross margin, and margin percentage, while also examining monthly performance patterns, supplier-level contribution, and team- and category-based revenue distribution.
By combining KPI reporting with comparative and time-based analysis, the dashboard helps explain not only how much revenue is being generated, but also how efficiently that revenue is converted into profit.
A structured Power BI data model was used to connect fact and dimension tables, allowing the report to deliver accurate calculations, flexible filtering, and more meaningful analytical insights across different business perspectives.
As a result, the project provides a practical and interactive reporting experience that supports stronger financial monitoring, performance evaluation, and more data-driven decision-making.