Project Overview
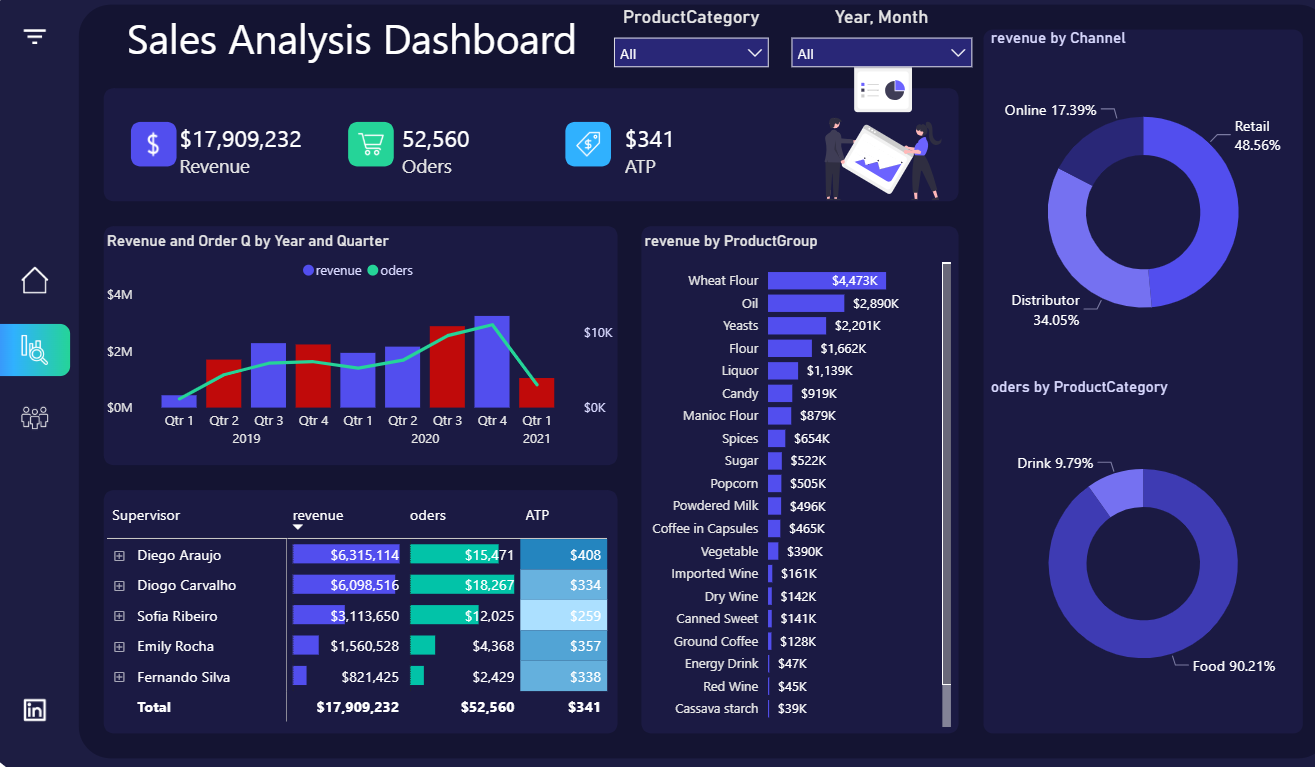
This Sales Analysis Dashboard was designed as a multi-dimensional Power BI reporting solution to evaluate commercial performance from both operational and strategic perspectives.
The project focuses on key sales indicators such as revenue, orders, and average transaction performance, while also exploring trends by year and quarter, product group contribution, sales channel distribution, and category-level order behavior.
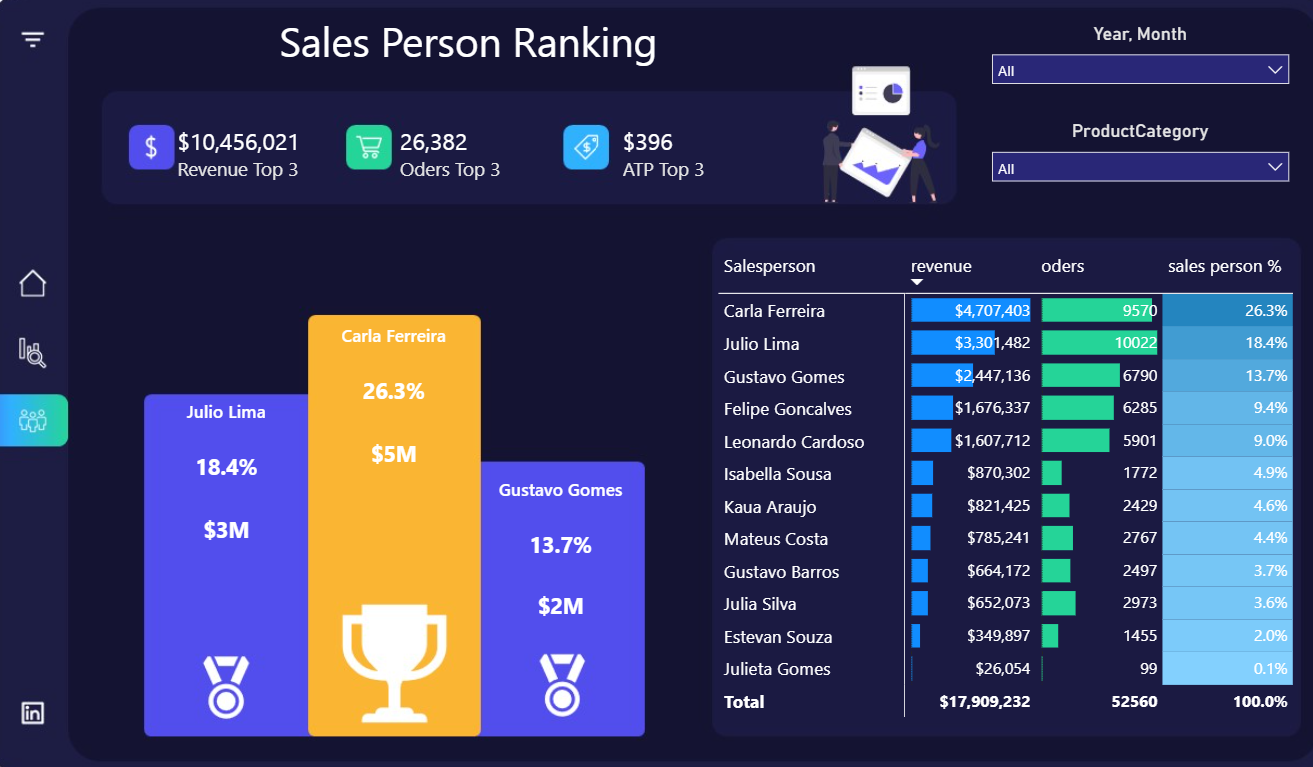
Beyond the general sales overview, the dashboard includes a dedicated salesperson ranking analysis that highlights individual contribution, compares top performers, and provides a clearer understanding of how team performance drives overall business results.
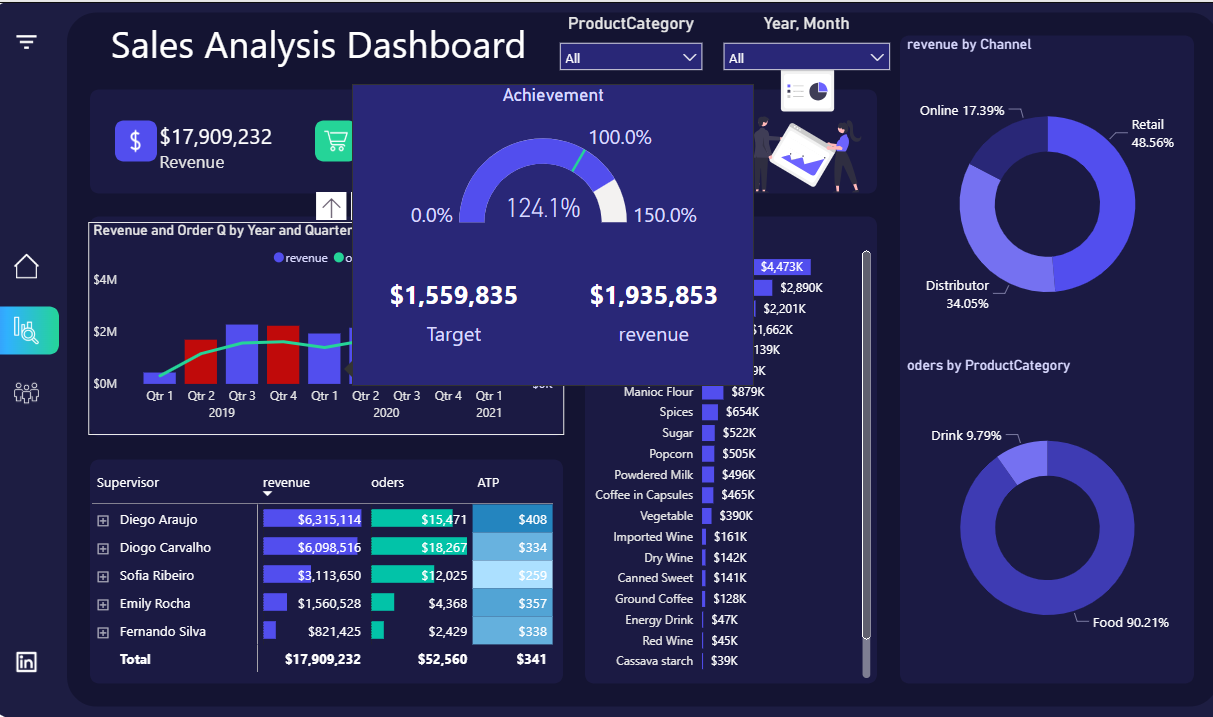
The report also incorporates target and achievement analysis, allowing actual sales performance to be evaluated against business expectations and making it easier to identify progress, underperformance, and growth opportunities.
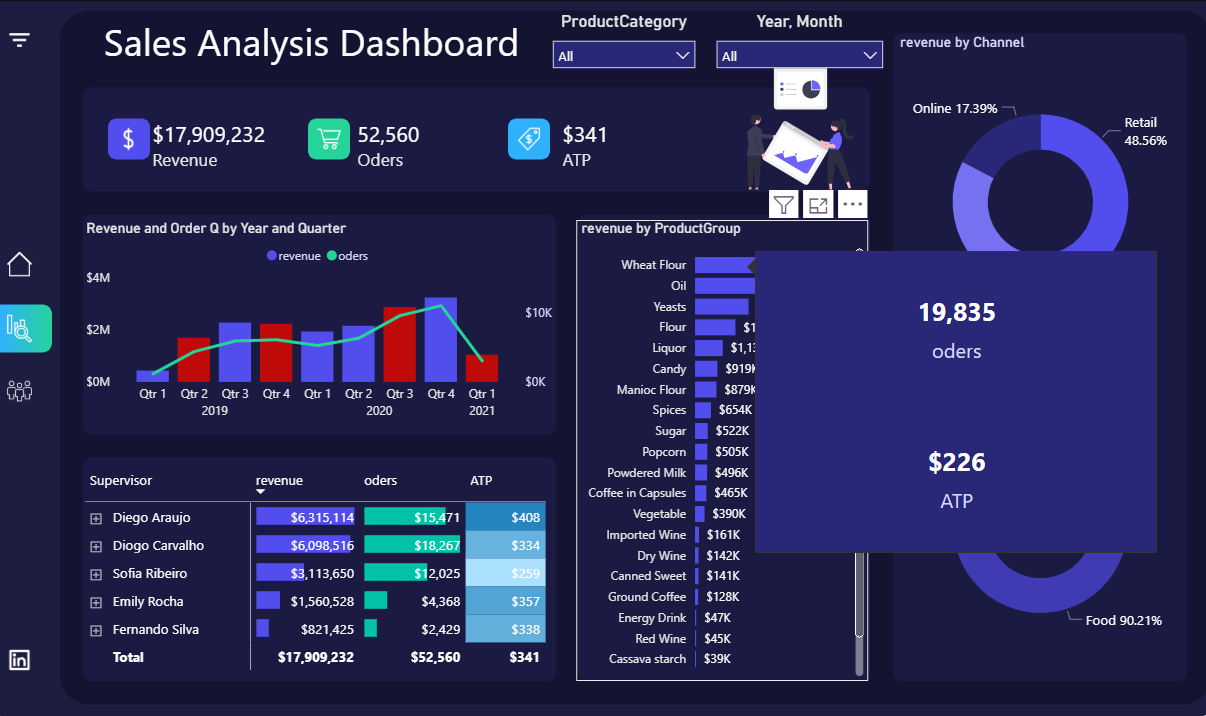
Using a structured data model and calculated measures, the dashboard delivers interactive filtering, contribution analysis, ranking logic, and performance monitoring in a way that turns raw sales data into meaningful and decision-ready insights.